Debugging

This article explains how to use the Firefox developer tools to debug extensions.

An extension can consist of several components—background scripts, popups, options pages, content scripts, sidebars, and alike—and you use slightly different workflows to debug each component. Each component has a section in this article, and you can read each section in isolation. We begin by introducing the developer tools, which you use to debug all the pieces of your extension.

Developer tools toolbox

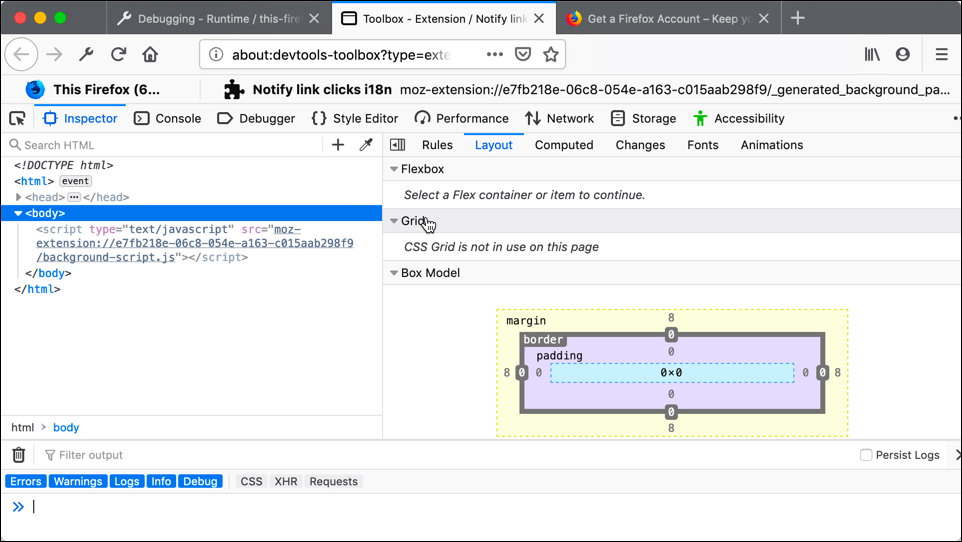
You use an implementation of the developer tools called Toolbox to debug extensions. To open Toolbox for an extension:

  • enter about:debugging in the URL bar.
  • in the left-hand menu, click This Firefox (or This Nightly).
  • click Inspect next to your extension.

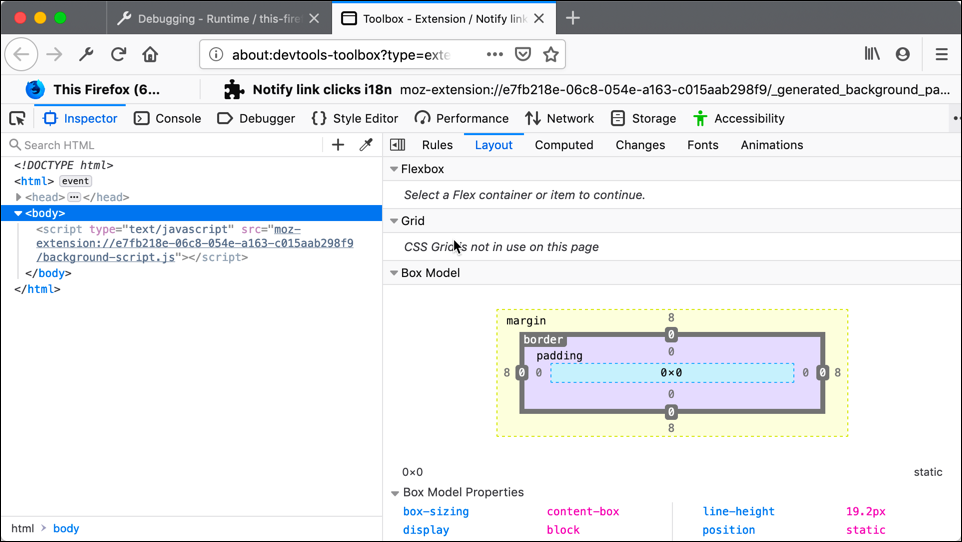
A new tab opens showing Inspector in the Toolbox.

developers tool screenshot

To debug your extension, you use:

  • Inspector to examine and modify the HTML and CSS used to build your extension's pages.
  • Console to view messages logged by the extension and error messages logged by the browser as it runs the extension. It also provides a command line, where you can execute JavaScript in the extension's context.
  • Debugger to set breakpoints and watchpoints in your extension's JavaScript, and examine and modify the extension's state.
  • Storage to view details of data stored by the extension.

This console shows messages from your background script and extension pages; other logs may appear elsewhere.
There is an overview of all relevant places to look for messages at Viewing log output.

For much of the debugging work, it's useful to view Console with Inspector or Debugger. You do this using the split console, press esc to activate this mode.

developers tool split screenshot

You now drag the toolbox tab to a separate window, so you can place it alongside the window where you're executing the extension.

developers tool split screenshot

Viewing log output

Your extension can generate log messages, e.g., with the Console API or by triggering (uncaught) errors.

Log messages are usually viewed in the Console of the context where the script runs.

The Developer tools toolbox at about:debugging shows log messages from extension scripts. For specific cases, see:

Log messages from content scripts can be viewed in the developer tools of the tab where the content script runs instead of about:debugging, see:

Log messages not associated with an extension script, such as the stderr output of the nativeMessaging API can only be viewed in the Browser Console. This console contains messages from the whole browser, including your and other extensions. It occasionally contains more detailed information about errors reported to your extension. For more information, see:

Debugging background scripts

We use the notify-link-clicks-i18n extension example to illustrate the debugging features relevant to background scripts. This example is in the webextensions-examples repository.

Background scripts enable an extension to monitor and react to events in the browser, such as navigating to a new page, removing a bookmark, or closing a tab. These scripts can be persistent or non-persistent. Persistent background scripts remain loaded for the lifetime of the extension. In contrast, non-persistent background scripts load when needed to respond to an event and unloaded when they become idle. Non-persistent background scripts are recommended because they consume less of the browser's resources.

Background scripts are loaded inside an invisible background page: by default, this is an empty HTML document, but you can specify a custom page and define it as the background page using the manifest.json background key.

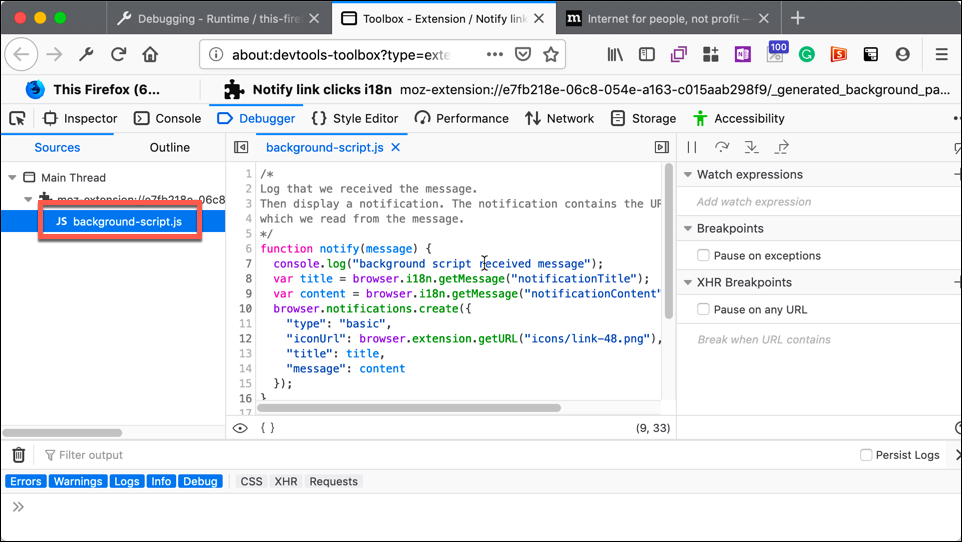
To debug background scripts, use the Toolbox Debugger in the split console view so you can view the Console below Debugger.

To get started, open your background script in Sources.
background script screenshot

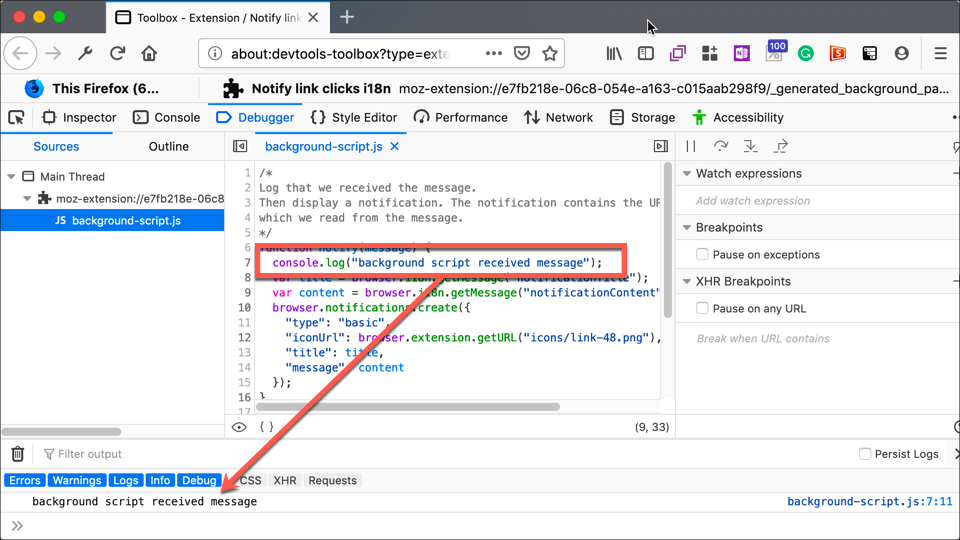
As you run your extension, the Console displays logged output, including calls to console.log() made by the extension's background scripts and any errors the browser raises as it executes these scripts. Note that the console shows all errors raised by the browser, not just errors related to your extension's code.

When you debug a non-persistent background script, the background script won't go idle while the toolbox is open. However, if you need to terminate the background page, you can do so in about:debugging.

For example, the notify-link-clicks-i18n example extension logs a message from its background script when it receives a message from one of its content scripts.
background script console log screenshot

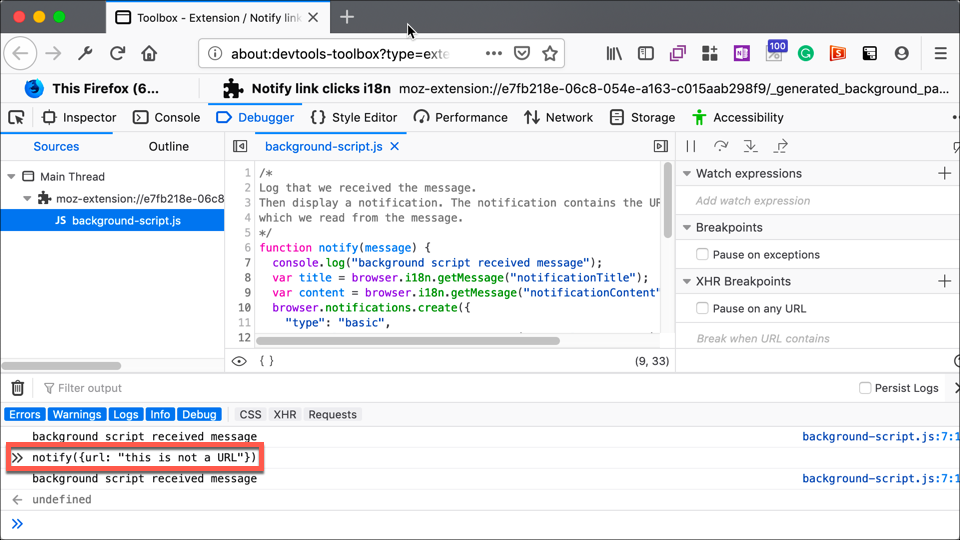
Using the Console command line, you can access and modify the objects created by your background scripts. For example, you can call the notify() function:
execute from console screenshot

In the Debugger you can set breakpoints, step through code, modify the extension's state, and do everything else you'd expect to be able to do in a debugger.
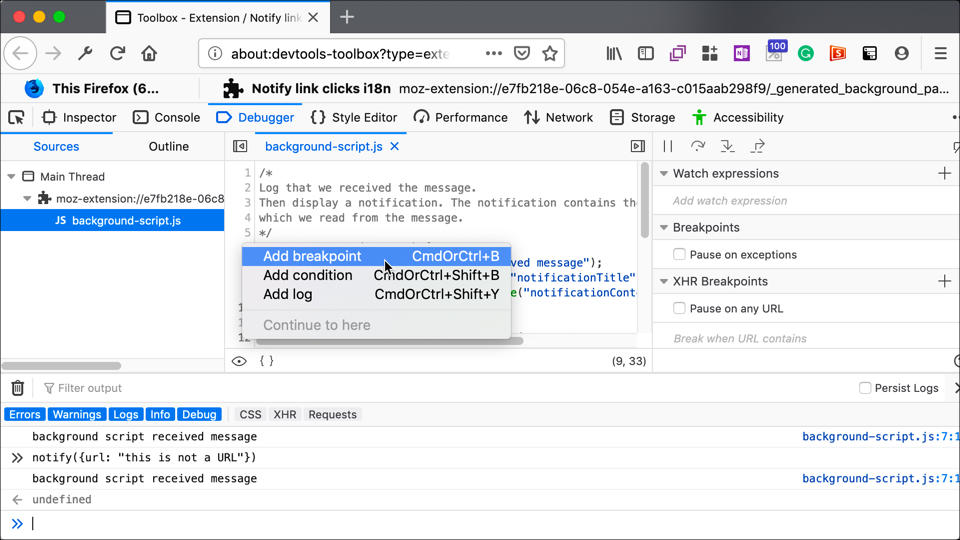
add breakpoint screenshot

For more information about using the debugger, see the Debugger guide.
Debugging options pages

We use the favourite-colour extension example to illustrate the debugging features relevant to options pages. This example is in the webextensions-examples repository.

An options pages is an HTML page shown when the user accesses your extension's preferences in Add-ons Manager, either by opening Add-ons Manager themselves or using a link provided in your extension. You use an options page to enable the user to set and save options and settings that affect the behavior of your extension. Options pages display in an iframe in Add-ons Manager.

To debug options pages, use the Toolbox Debugger in the split console view so you can view the Console below Debugger.

To get started:

  • enter about:addons in the URL bar, to open Add-ons Manager.
  • open your extension's preferences:

open preferences screenshot

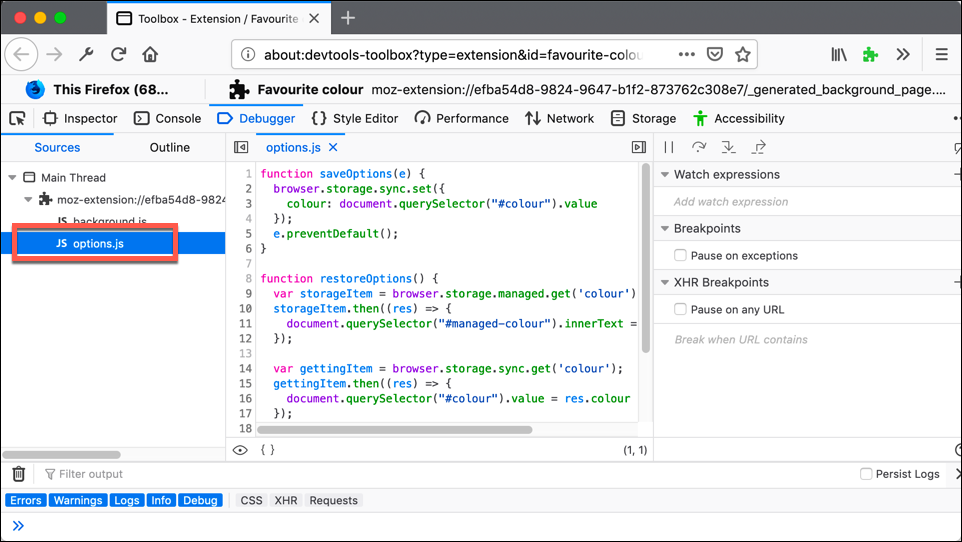
  • locate the options page script in Sources.

open scripts in debugger screenshot

In the Debugger you can set breakpoints, step through code, modify the extension's state, and do everything else you'd expect to be able to do in a debugger. Any messages logged by your code display in Console.

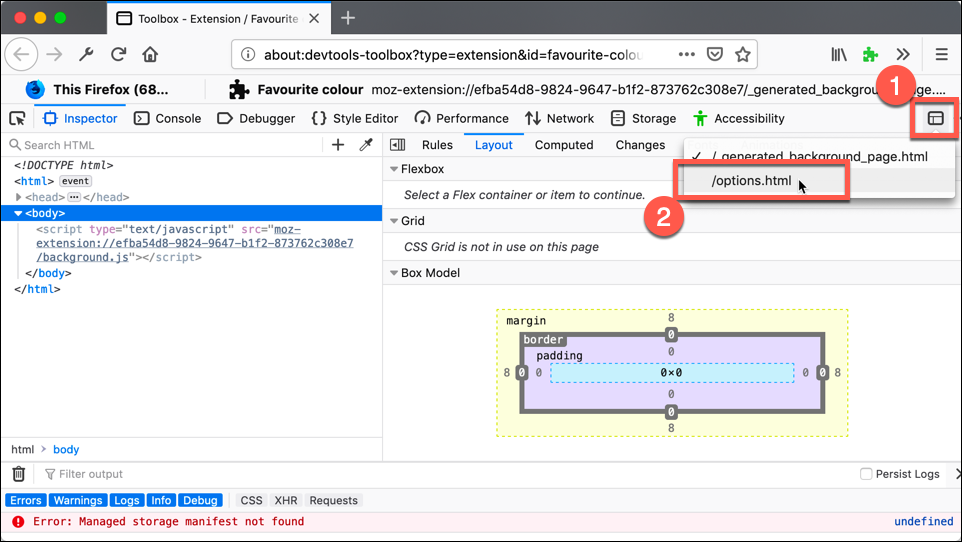
To debug the options page's HTML and CSS, point the tools at the iframe that hosts the page. To do this:

  • switch to Inspector.
  • click the page selector (1).
  • click the options page's HTML item (2).

open options page HTML screenshot

For more information about using Inspector, see the Inspector guide.

Debugging popups

We use the beastify extension example to illustrate the debugging features relevant to popups. This example is in the webextensions-examples repository.

Popups are dialogs attached to browser or page actions. Popups are specified using an HTML document that can include CSS and JavaScript, which define styling and behavior.

To debug popups, use the Toolbox Debugger in the split console view so you can view the Console below Debugger.

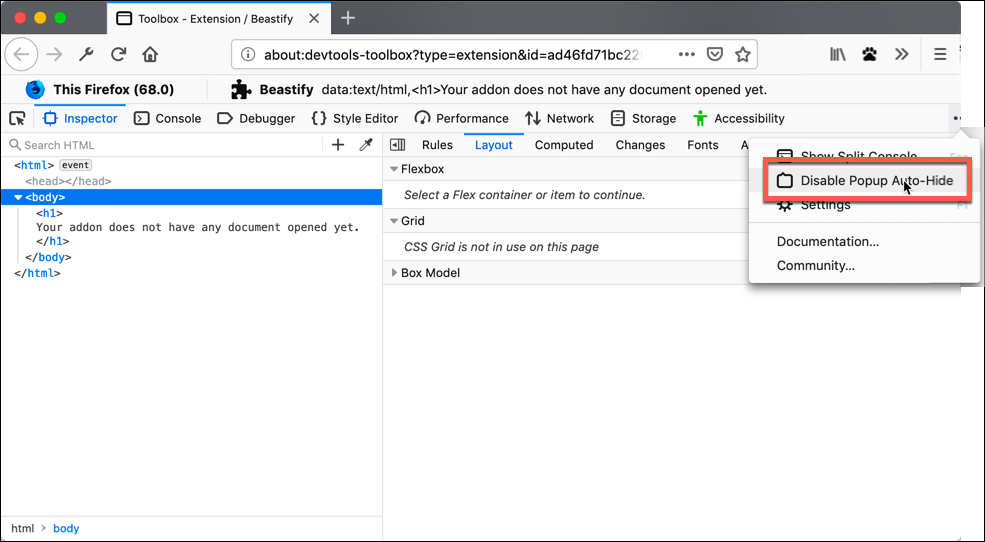
To debug a popup it needs to be visible (so that its HTML document is loaded). However, having opened a popup, if you click outside the popup it closes and its code unloads. This would appear to make debugging rather difficult. To overcome this challenge, in the options menu, click Disable Popup Auto-Hide.

disable popup auto-hide screenshot

Now, when you open a popup it stays open and its code remains loaded.

Disable popup auto-hide also applies to built-in browser popups, such as the options menu. The setting doesn't persist across sessions. When you close the window, the setting reverts to auto-hide popups.

Internally, this option toggles the ui.popup.disable_autohide preference, which you can toggle manually from about:config.

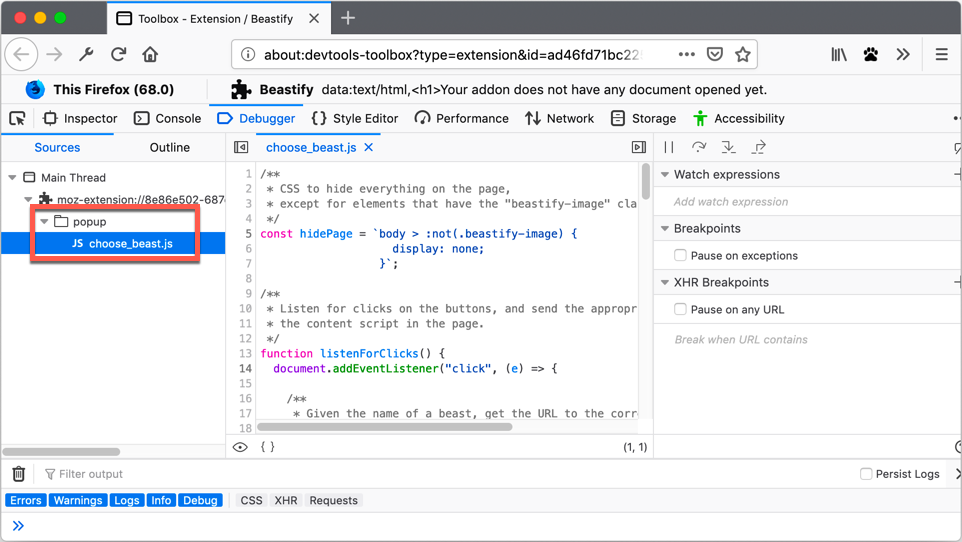
With the popup open, its JavaScript sources are listed in Debugger. In the Debugger you can set breakpoints, step through code, modify the extension's state, and do everything else you'd expect to be able to do in a debugger. Any messages logged by your code display in Console.

popup in debugger screenshot

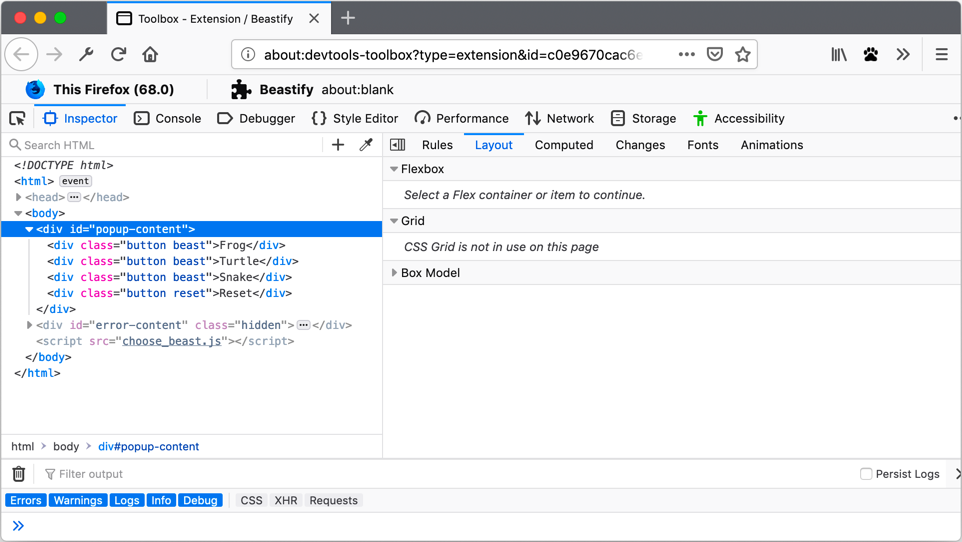
To inspect the popup's HTML and CSS, use Inspector in the split console view so you can view the Console below Inspector. You can review and modify the popup's HTML and CSS in Inspector, as you would with any webpage.

popup in inspector screenshot

If your extension has multiple HTML documents open, click the page select icon (pages selector) to open the popup's document.

Debugging content scripts

We use the notify-link-clicks-i18n extension example to illustrate the debugging features relevant to content scripts. This example is in the webextensions-examples repository.

A content script is a part of your extension that runs in the context of a webpage; it enables your extension to react to events on the webpage and make changes to its content.

Because Firefox is multiprocess, content scripts run in a different process than other parts of an extension. Therefore, to debug content scripts, you use the developer tools for the page containing the script. To do this:

  • in the Firefox menu (or Tools menu if you display the menu bar or are on macOS), click Web Developer, then Debugger.
  • press Ctrl + Shift + i (Command + Option + i on macOS) and click Debugger.

If you activated the split console view, to view the Console below Debugger, the tools open in this mode. Otherwise, press esc to activate this mode.

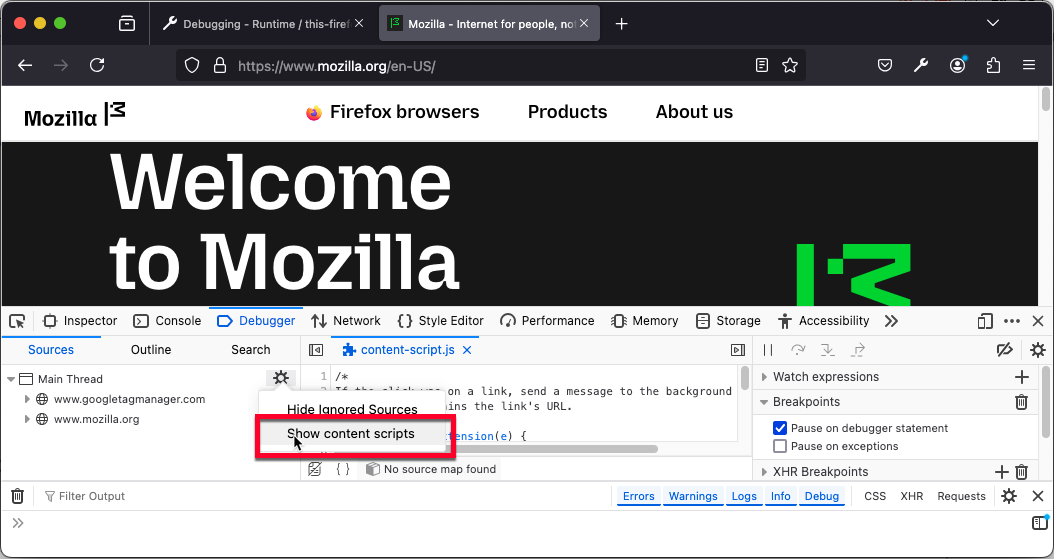
Content scripts may not be visible by default. If you can't see your extension and its content scripts, click the gear icon in Sources and select Show content scripts.

content script in debug

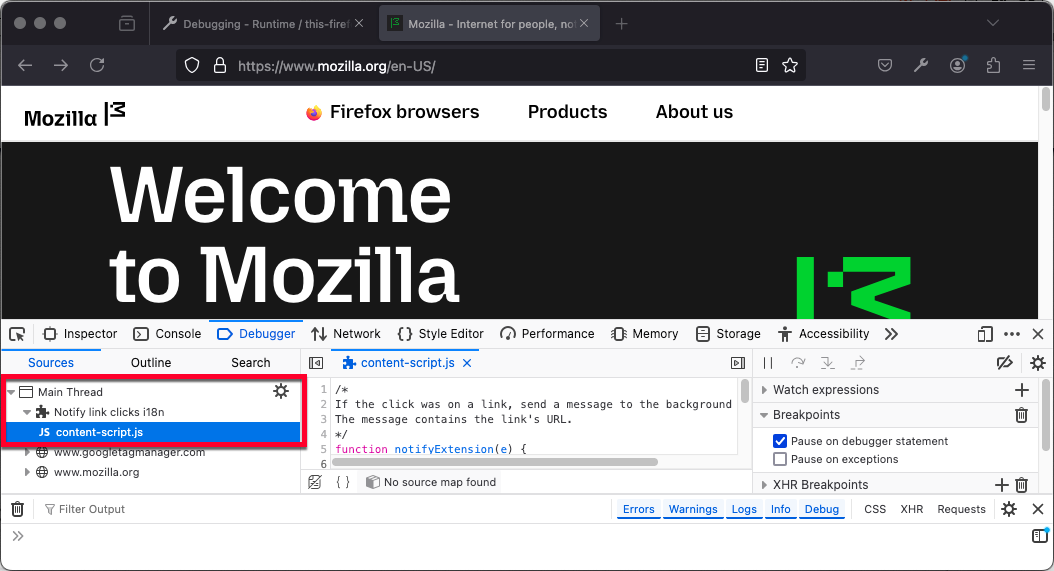
Now, select your content scripts in Sources.

content script in debug

You can set breakpoints, step through code, modify the extension's state, and do everything else you'd expect to be able to do in a debugger. Any messages logged by your code display in Console.

If the developer tools tab was not open when the content script was injected, the content script may not be listed in Sources. Reload the page with the developer tools open to show the content script.

Debugging sidebars

We use the annotate-page extension example to illustrate the debugging features relevant to sidebars. This example is in the webextensions-examples repository.

A Sidebar is a pane displayed at the side of the browser window, next to the web page. Sidebars are specified using an HTML document that can include CSS and JavaScript, which define styling and behavior.

To debug a sidebar, use the Toolbox Debugger in the split console view so you can view the Console below Debugger.

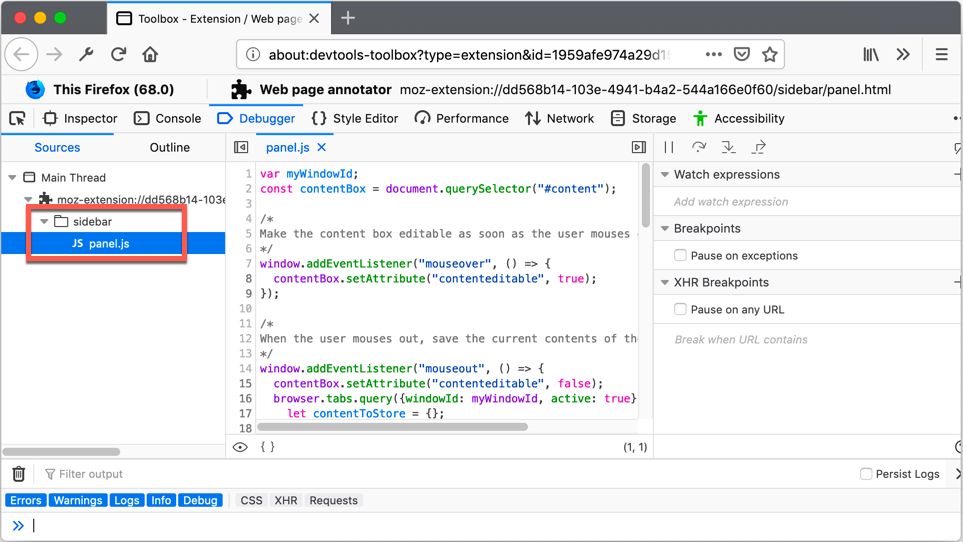
To debug a sidebar, open the sidebar and locate its JavaScript in Debugger.

sidebar script in debugger

In the Debugger you can set breakpoints, step through code, modify the extension's state, and do everything else you'd expect to be able to do in a debugger. Any messages logged by your code display in Console.

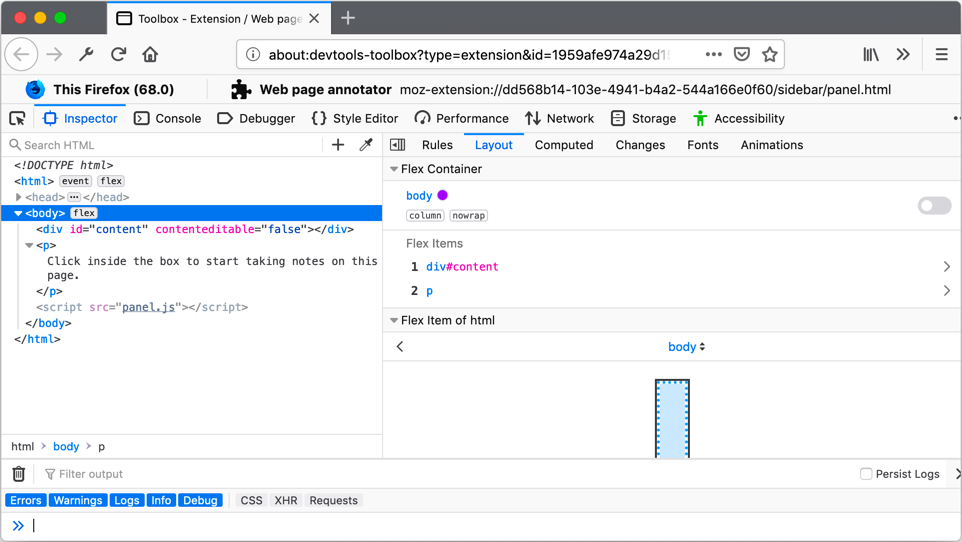
To inspect the sidebar's HTML and CSS, use Inspector in the split console view so you can view the Console below Inspector. You can review and modify the sidebar's HTML and CSS in Inspector, as you would with any webpage.

sidebar script in debugger

If your extension has multiple HTML documents open, click the page select icon (pages selector) to open the sidebar's document.

Debugging storage

We use the annotate-page extension example to illustrate the debugging features relevant to extension storage. This example is in the webextensions-examples repository.

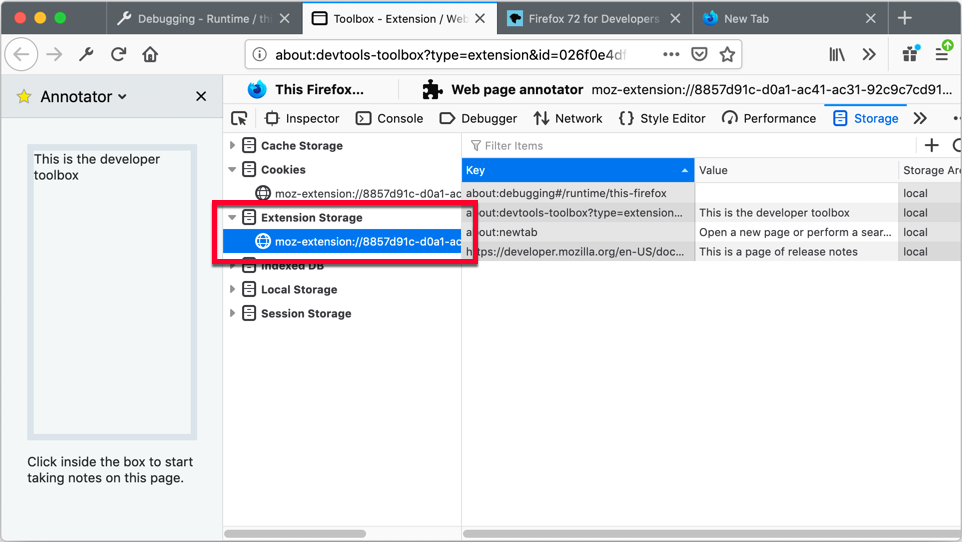
An extension can store data using the Storage API. To view this data, in the Toolbox open the Storage tab and locate Extension Storage.

sidebar script in debugger

Debugging developer tools pages and panels

We use the devtools-panels extension example to illustrate the debugging features relevant to developer tools pages and panels. This example is in the webextensions-examples repository.

Developer tools are extended with a hidden HTML page that is loaded when the tools are opened. From the hidden HTML page, developer tools panels can be added; these are HTML pages displayed as a tool tab in the browser UI.

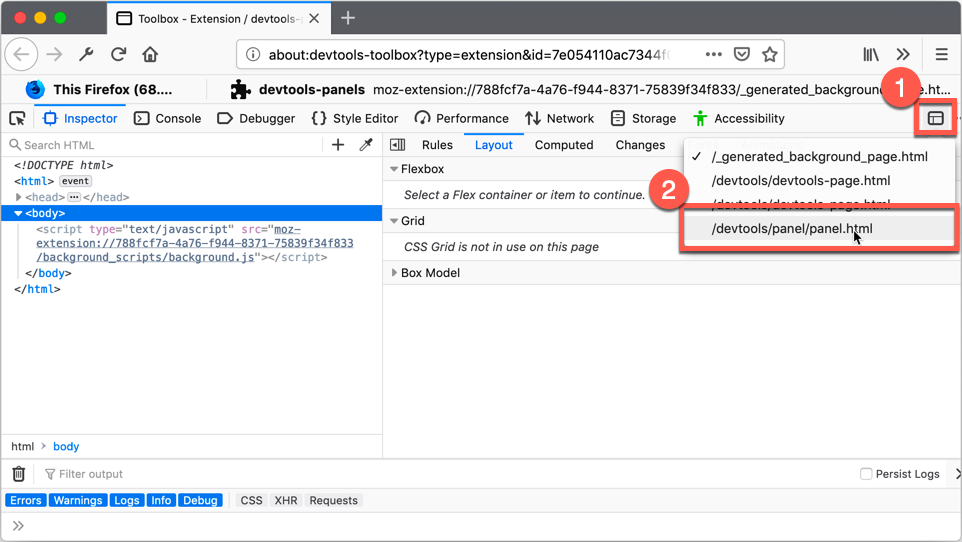
To debug development tools pages and panels, use the Toolbox Debugger in the split console view so you can view the Console below Debugger.

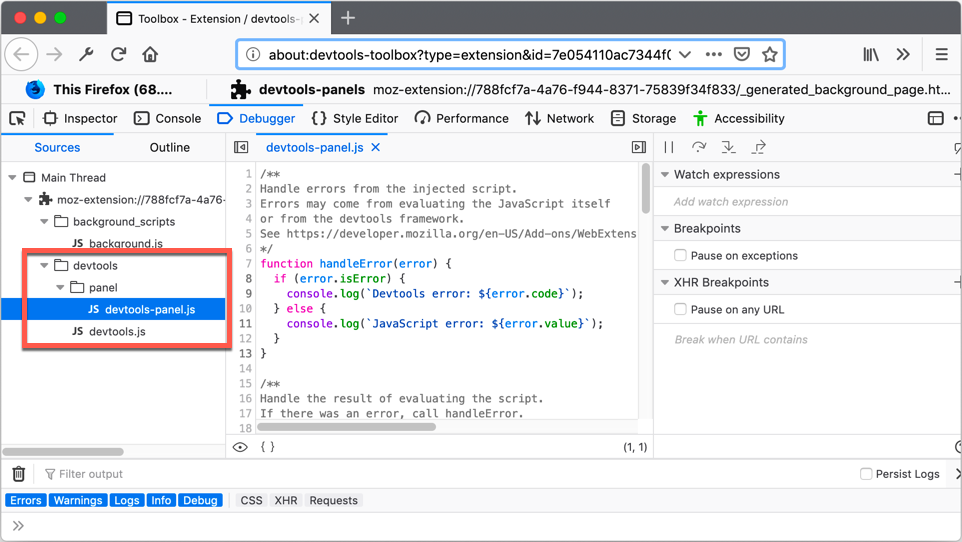
To debug additions to the developer tools, open the developer tools and any custom panels, and locate their JavaScript in Debugger.

developer tools in debugger

In the Debugger you can set breakpoints, step through code, modify the extension's state, and do everything else you'd expect to be able to do in a debugger. Any messages logged by your code display in Console.

To debug the custom developer tools pages' HTML and CSS:

  • switch to Inspector.
  • click the page selector (1).
  • click the custom development tools page item you want to inspect (2).

developer tools selecting page in inspector

You can review and modify the custom development tools page HTML and CSS in Inspector, as you would with any webpage.

Debugging browser restarts

If your extension could be affected by the browser restarting, such as when a session is restored, you may want to test to ensure your code works as expected in those conditions.

For more details, see Testing persistent and restart features.